
Aboriginal and treaty rights have been constitutionally protected across Canada since the enactment of the Constitution Act, 1982. Yet while the same constitutional protections apply across Canada, the ability for Indigenous peoples to rely on and benefit from these protections can vary significantly depending on the province or territory in which they reside. One indicator of these disparate conditions can be seen in the degree to which Indigenous governments benefit from mineral resource extraction across Canada.
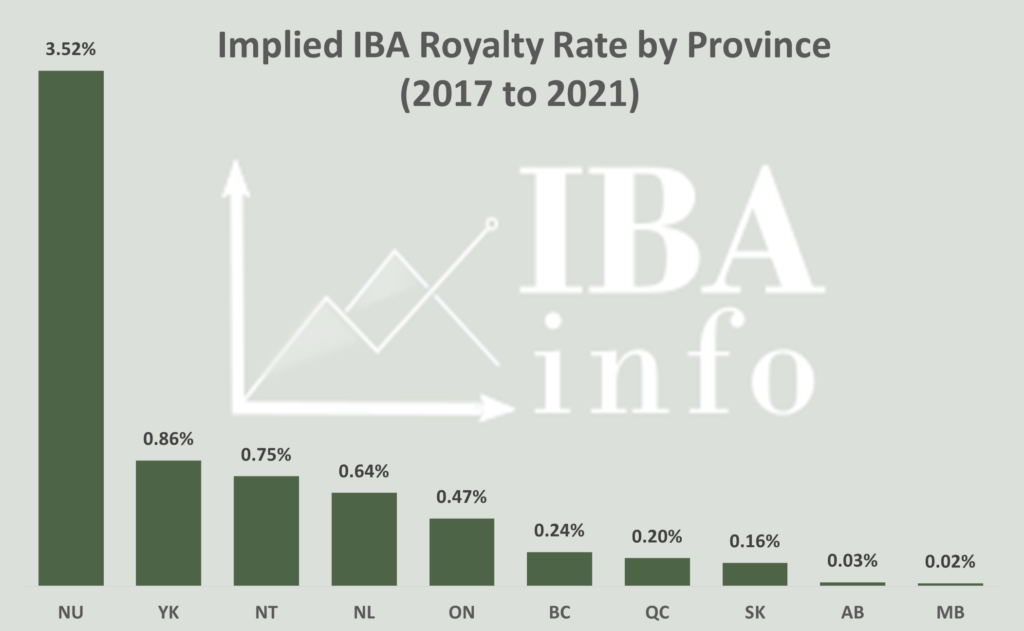
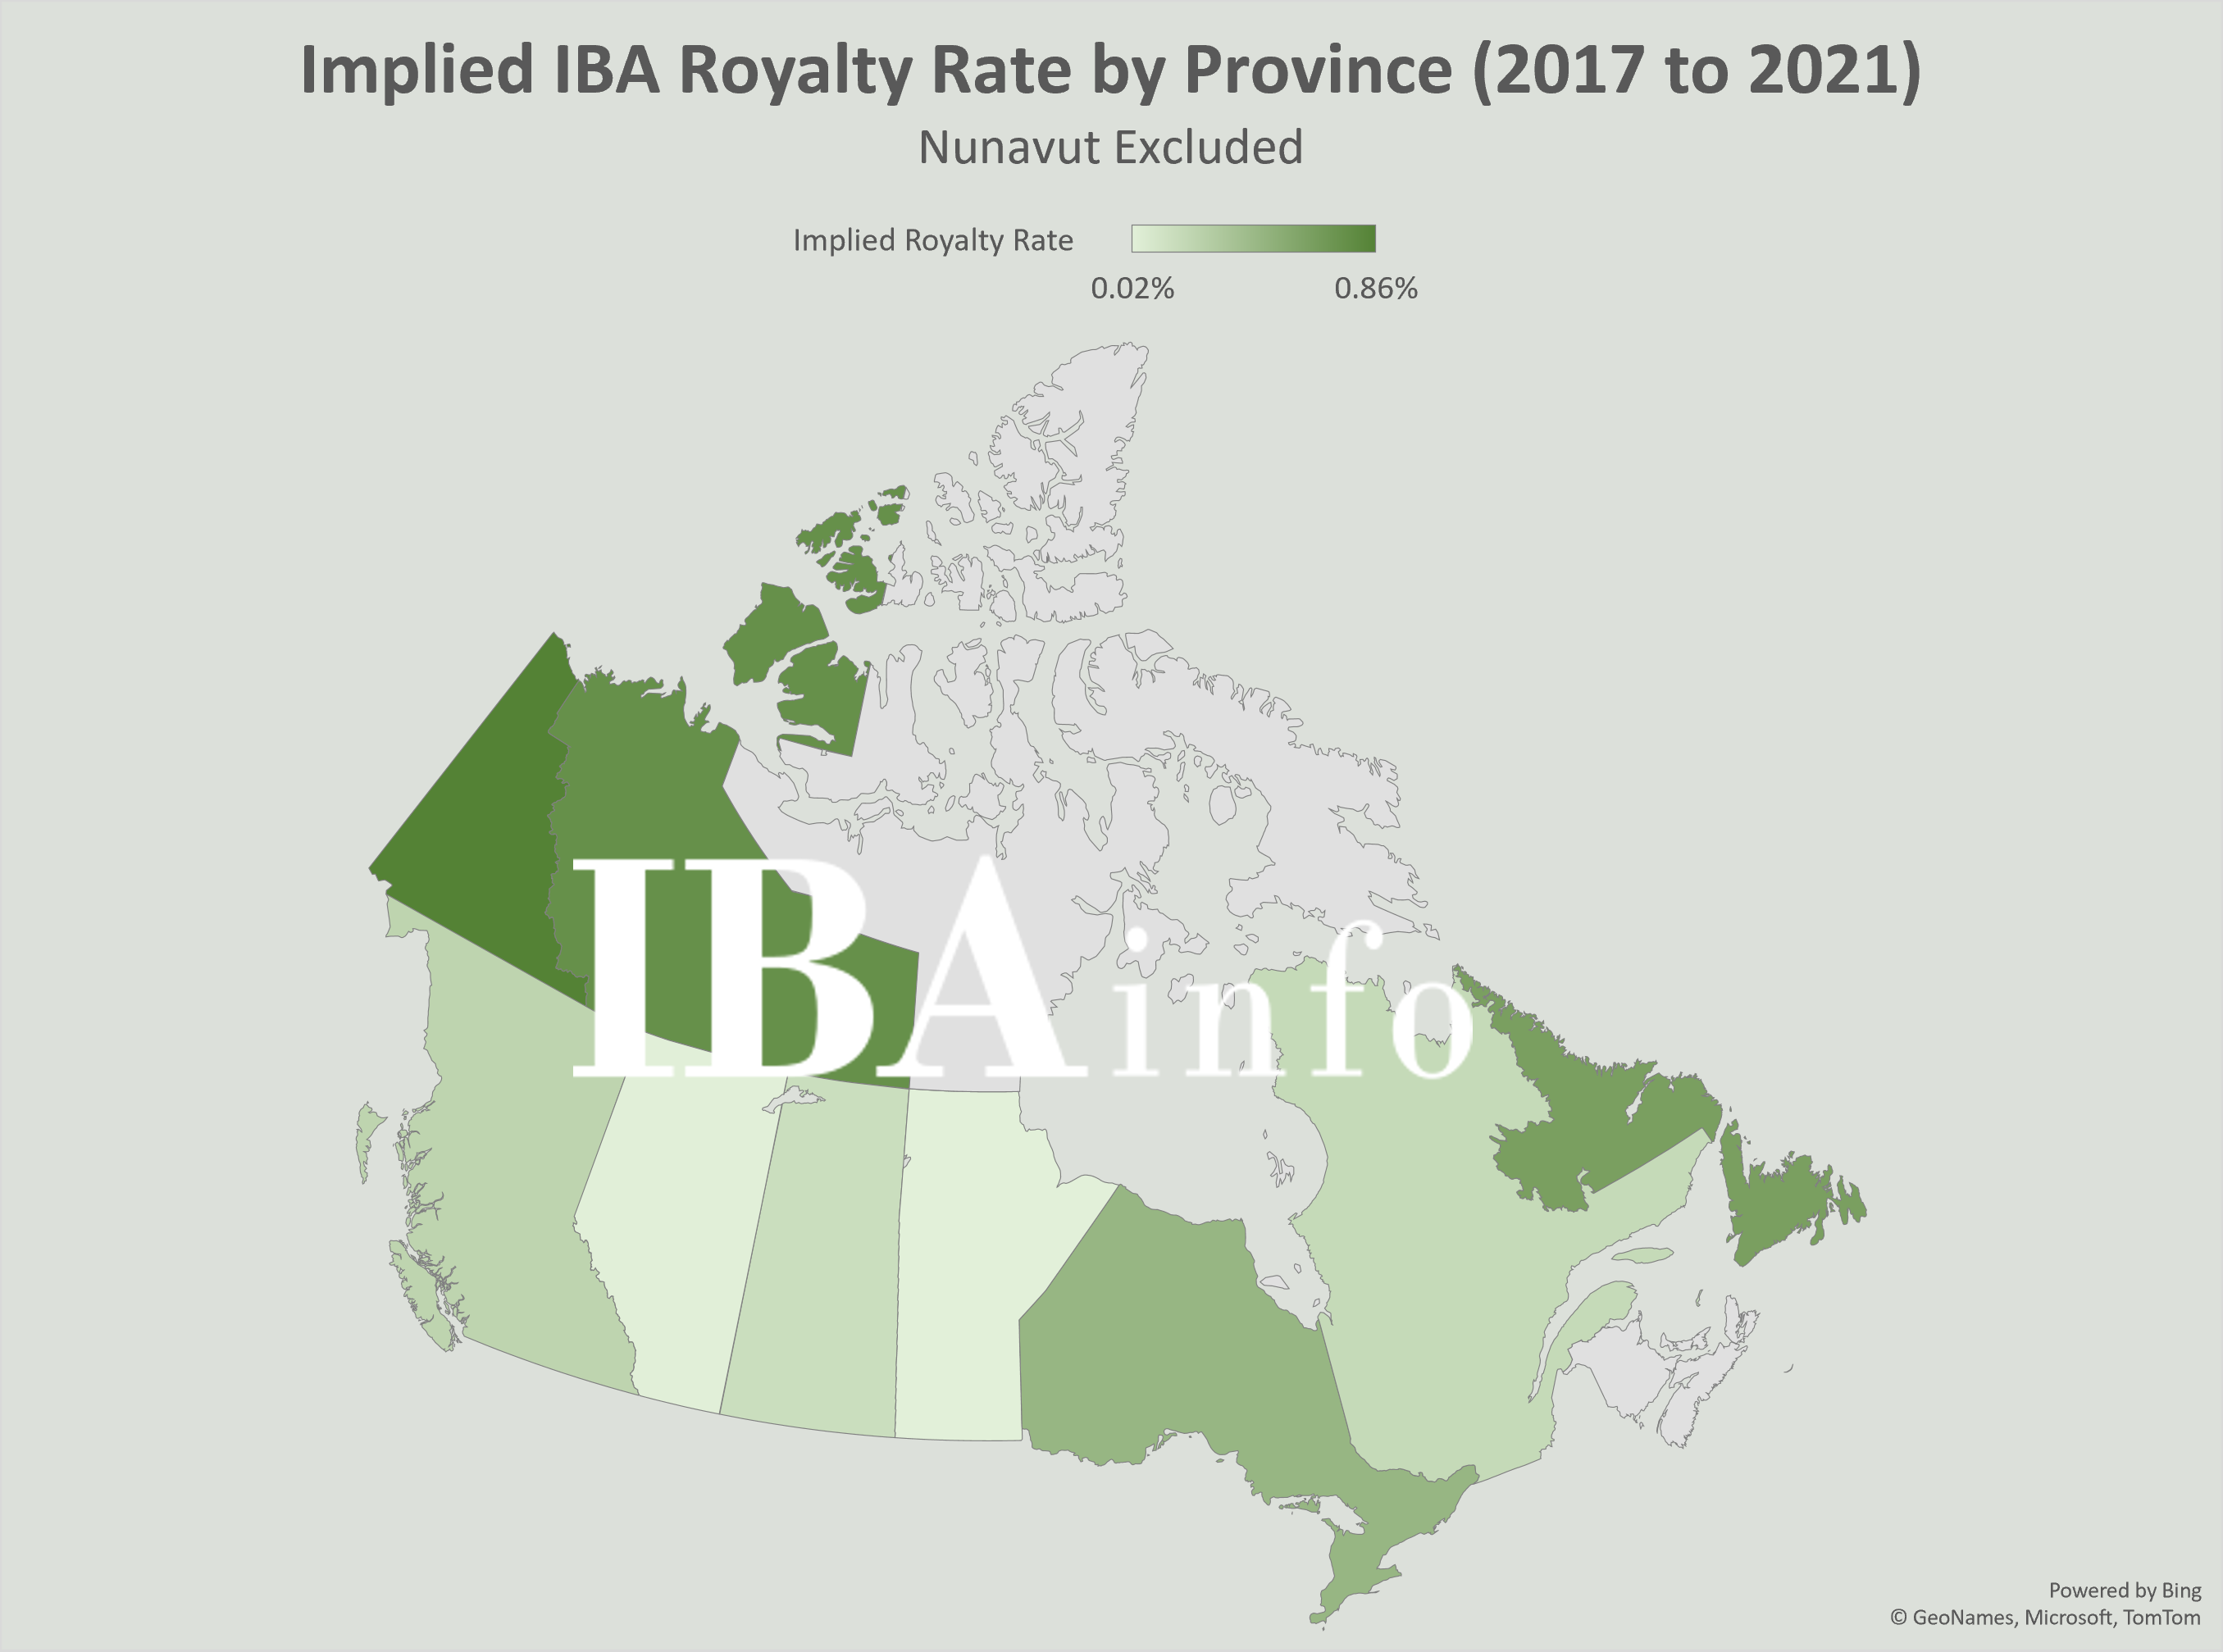
Payments to Indigenous Organizations as a Percentage of the value of mining shipments, as measured using ESTMA reporting.
In preparing this analysis, we have reviewed over $1 billion in payments to Indigenous parties disclosed in Extractive Sector Transparency Measures Act (“ESTMA”) reports for the years 2017-2021. These have been compared against Statistics Canada’s “Annual Statistics of Mineral Production” reports on the value of minerals shipped during the same period.
The data suggests that payments to Indigenous governments (often negotiated through agreements sometimes referred to as Impact Benefit Agreements or “IBAs”) are highly correlated to the provincial and territorial political and legal environment. IBA payments are lowest in the Canadian prairies, at moderate rates in BC and Ontario, and reach their highest rates in the Canadian territories. This trend seems to generally reflect the role that Indigenous governments play, and leverage they have, in the context of government approvals. From the prairies, which are often perceived as industry friendly, to the Northwest Territories and Nunavut where Indigenous governments play a significant role in industry regulation.
Outlined below are some factors that are relevant to understanding the data:
Older Mines May Share Less
Modern mines are more likely to have entered into robust IBAs, including in response to modern regulatory pressure and the legal requirements for governments to consult with Indigenous peoples which was first articulated by the Supreme Court of Canada in 2004. Older mines may not have IBAs or may provide lower payments to Indigenous communities. As a consequence, the implied royalty reported for jurisdictions with significant older operating mines (such as Ontario or Quebec) may be much lower than the implied royalties that are being shared by newer mines in those jurisdictions.
Government Revenue Sharing Is Not Included
Some jurisdictions, including British Columbia, Ontario, and the Northwest Territories, have processes in place for sharing mineral royalty revenues with some Indigenous communities. British Columbia appears to be a leader in this respect, and has entered into a number of revenue sharing agreements that can provide a significant portion (in some cases up to 37.5%) of royalty revenues to Indigenous governments. This revenue is not reflected in the data we have reviewed.
Challenges with Understanding ESTMA Data
There are significant challenges with consistency among ESTMA data and understanding the basis upon which payments are made. For example, in some cases, payments for goods and services paid to an Indigenous entity may be reported under ESTMA and included in the data. Over time, as more ESTMA reports are provided, it may be possible to better identify and isolate these types of payments. In preparing the Saskatchewan data we removed $7.1 million that was disclosed as being paid to Nuna Logistics (out of a total of $54.7 million paid in the period) but similar unidentified procurement payments may persist in the data.
Lumpy Payments
Some of the payments recorded were made in respect of projects that are not yet operational. These amounts may represent one-time milestone payments that may not correlate with mineral production in the year and may not be replicated in the future. For example, Saskatchewan’s payments included over $9 million associated with the Rook 1 Project, while Yukon’s numbers included over $6 million for the Coffee Project (out of a total of $16 million in payments for the 5 year period), both of which are not yet in production. These types of payments remain in the data since they represent sharing in the overall mineral resource potential. As additional ESTMA data becomes available, it may be possible to “smooth” this data and identify the long-term trends.